Copyright: © 2025 by the authors. Licensee: Pirogov University.
This article is an open access article distributed under the terms and conditions of the Creative Commons Attribution license (CC BY).

OPINION

Hygienic education of younger schoolchildren using a rational nutrition skills development program

Tsukareva EA, Avchinnikov AV
About authors

Smolensk State Medical University, Smolensk, Russia

Correspondence should be addressed: Ekaterina A. Tsukareva
25 Sentyabrya, 30a, ap. 148, Smolensk, 214019, Russia; ur.liam@51iseval

About paper

Author contribution: the authors have made equal contributions to this publication.

Compliance with ethical standards: the study was approved by the Ethics Committee of the Smolensk State Medical University (protocol No. 1 of October 24, 2017). Each participant signed a voluntary informed consent form. The study conformed to the principles of biomedical ethics and did not endanger the participants.
Received: 2024-10-28 Accepted: 2024-12-21 Published online: 2025-03-17
|
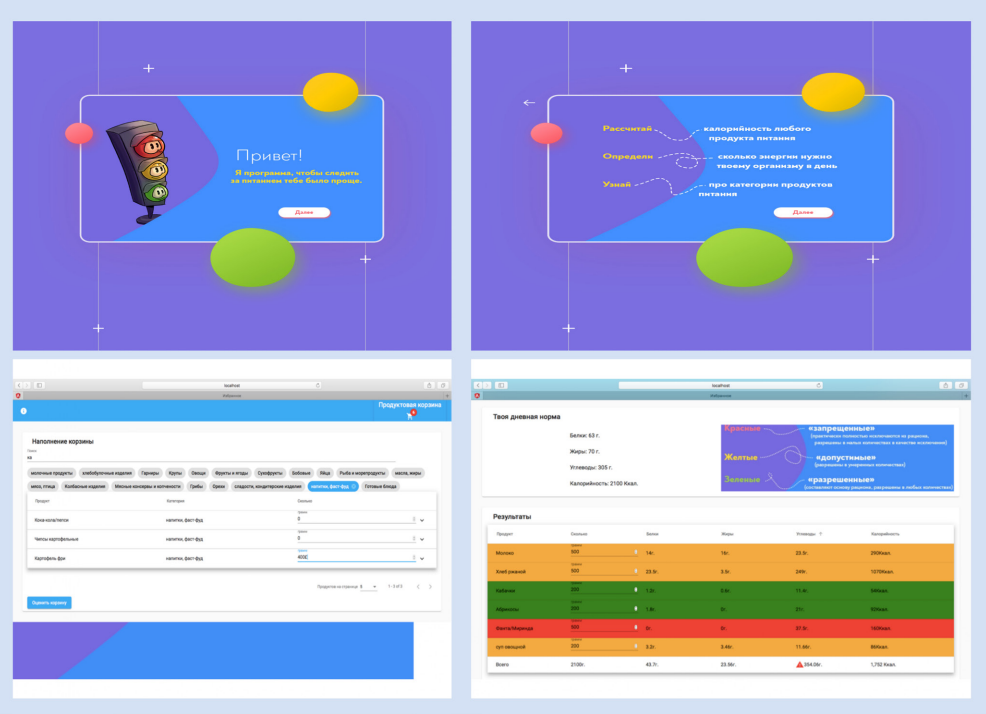
Fig. 1. Interface of the Children and Adolescents Individual Diet Calculation and Hygienic Assessment Module
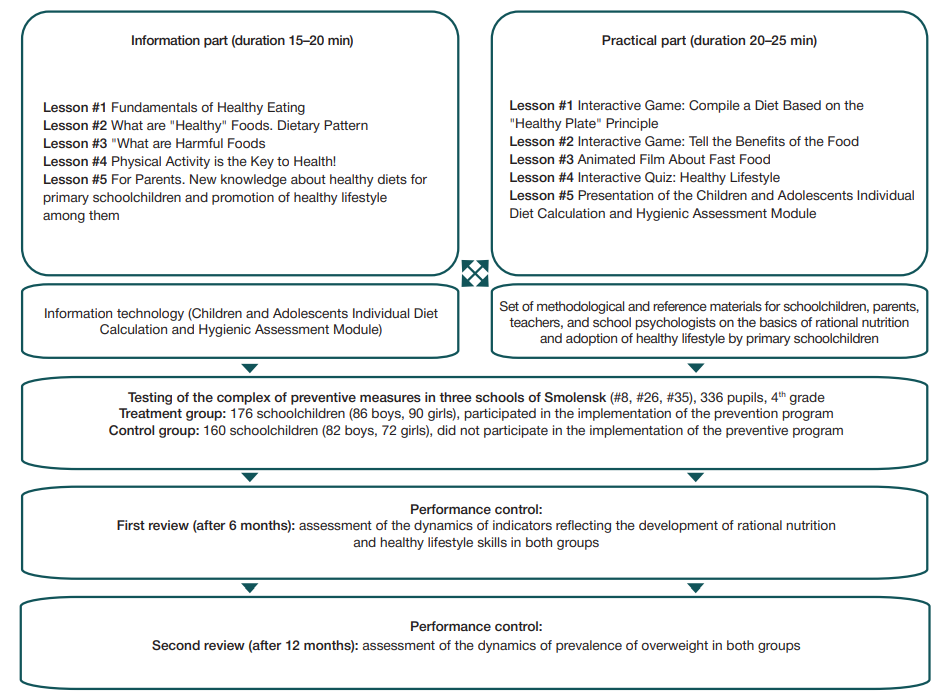
Fig. 2. The algorithm of the rational nutrition and healthy lifestyle skills development program
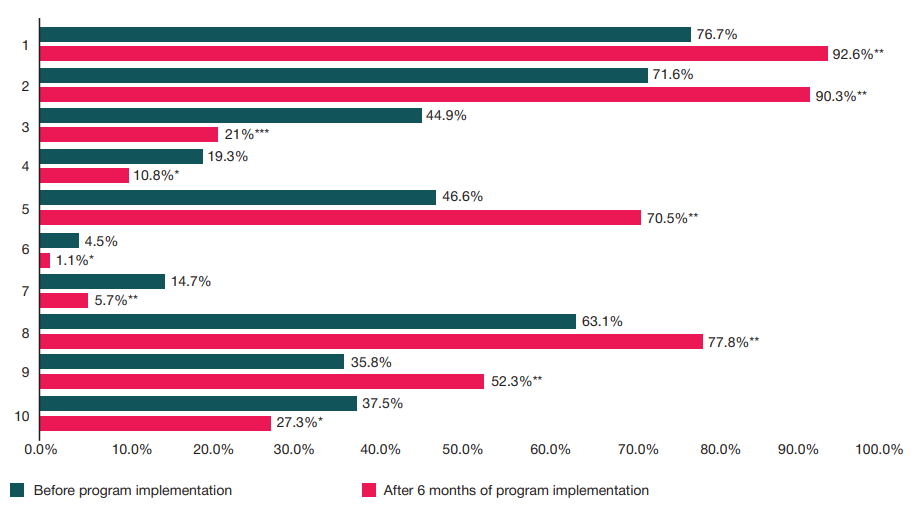
Fig. 3. Indicators of the treatment group schoolchildren
Note: 1 — the share of schoolchildren eating regular meals; 2 — the share of schoolchildren regularly having breakfast at home; 3 — the share of schoolchildren regularly snacking between meals; 4 — the share of schoolchildren regularly snacking before bedtime; 5 — the share of schoolchildren regularly adding fresh vegetables and fruits to their diet; 6 — the share of schoolchildren regularly consuming fast food products; 7 — the share of schoolchildren regularly consuming sugary carbonated drinks; 8 — the share of schoolchildren practicing energetic leisurely activities outdoors every day; 9 — the share of schoolchildren doing extracurricular sports; 10 — the share of schoolchildren preferring to spend their free time using a computer/tablet. The significance of the differences between the groups (Fisher z-transformation): * — p < 0.05; — p < 0.01; * — p < 0.001.
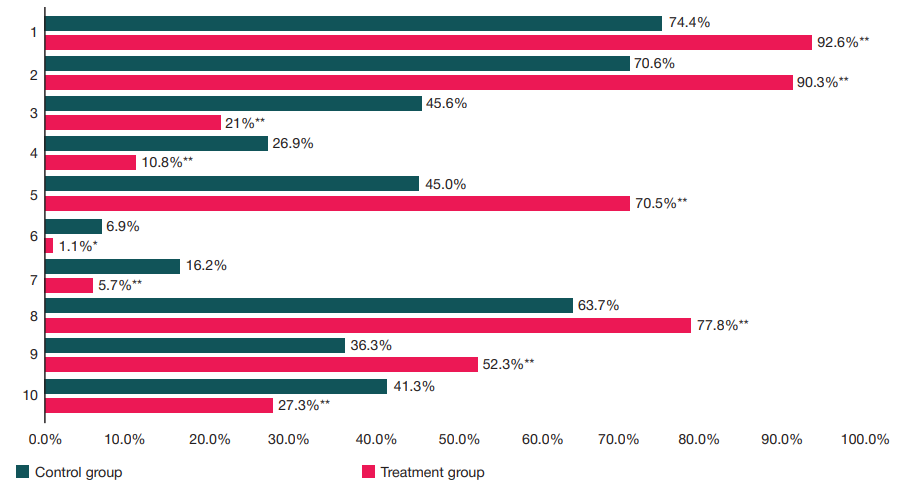
Fig. 4. Indicators of schoolchildren from the treatment group and the control group
Note: 1 — the share of schoolchildren eating regular meals; 2 — the share of schoolchildren regularly having breakfast at home; 3 — the share of schoolchildren regularly snacking between meals; 4 — the share of schoolchildren regularly snacking before bedtime; 5 — the share of schoolchildren regularly adding fresh vegetables and fruits to their diet; 6 — the share of schoolchildren regularly consuming fast food products; 7 — the share of schoolchildren regularly consuming sugary carbonated drinks; 8 — the share of schoolchildren practicing energetic leisurely activities outdoors every day; 9 — the share of schoolchildren doing extracurricular sports; 10 — the share of schoolchildren preferring to spend their free time using a computer/tablet. The significance of the differences between the groups (Fisher z-transformation): * — p < 0.05; — p < 0.01; * — p < 0.001.